FMZ量化交易中的K线数据处理
目前不清退的交易所推荐:
1、全球第二大交易所OKX欧意
国区邀请链接: https://www.myts3cards.com/cn/join/1837888 币种多,交易量大!
国际邀请链接:https://www.okx.com/join/1837888 注册简单,交易不需要实名,新用户能开合约,币种多,交易量大!
2、老牌交易所比特儿现改名叫芝麻开门 :https://www.gate.win/signup/649183
全球最大交易所币安,国区邀请链接:https://accounts.binance.com/zh-CN/register?ref=16003031 币安注册不了IP地址用香港,居住地选香港,认证照旧,邮箱推荐如gmail、outlook。支持币种多,交易安全!
买好币上KuCoin:https://www.kucoin.com/r/af/1f7w3 CoinMarketCap前五的交易所,注册友好操简单快捷!
FMZ量化交易平台邀请链接:https://www.fmz.com/
量化交易中的K线数据如何处理?
在编写量化交易策略时,使用K线数据,经常会出现需要非标准周期K线数据的情况。例如,需要12分钟周期K线数据和4小时K线周期数据。通常这种非标准的 Cycles 不是直接可用的。那么我们如何应对这样的需求呢?
非标准周期K线数据可以通过组合较小周期的数据得到。想象一下,多周期的最高价算作多周期K线合成后的最高价,最低价算作合成后的最低价,开盘价不变。合成K线原材料数据的第一开盘价。收盘价对应K线最后原材料数据的收盘价。时间采用开盘价k线的时间。交易量使用汇总和计算的原材料数据。
如图所示:
- 想法
我们以区块链资产 BTC_USDT 为例,将 1 小时合成为 4 小时。


时间
最高
打开
最低
关闭
2019.8.12 00:00
11447.07
11382.57
11367.2
11406.92
2019.8.12 01:00
11420
11405.65
11366.6
11373.83
2019.8.12 02:00
11419.24
11374.68
11365.51
11398.19
2019.8.12 03:00
11407.88
11398.59
11369.7
11384.71
四个 1 小时周期的数据合并为一个 4 小时周期数据。
开盘价为00:00第一条K线开盘价:11382.57
收盘价为03:00最后一条K线收盘价:11384.71
最高价为求其中最高价:11447.07
最低价为求其中最低价:11365.51
注:中国商品期货市场于正常交易日下午 3:00 收市
4小时周期开始时间是第一个1小时K线的开始时间,即2019.8.12 00:00
所有 1 小时 k 线的成交量之和作为该 4 小时 k 线成交量。
4小时K线合成:
High: 11447.07
Open: 11382.57
Low: 11365.51
Close: 11384.71
Time: 209.8.12 00:00
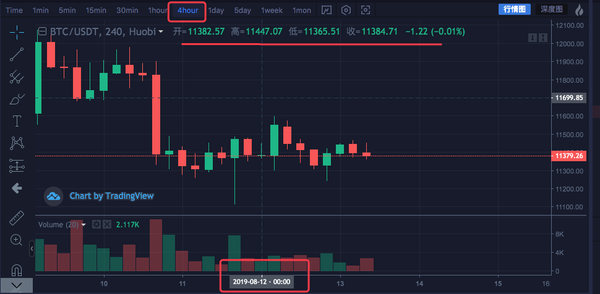

可以看到数据是一致的。
- 代码实现
了解初步思路后,可以手动编写代码实现需求。
这些代码仅供参考:
function GetNewCycleRecords (sourceRecords, targetCycle) { // K line synthesis function
      var ret = []

      // First get the source K line data cycle
      if (!sourceRecords || sourceRecords.length < 2) {
          Return null
      }
      var sourceLen = sourceRecords.length
      var sourceCycle = sourceRecords[sourceLen - 1].Time - sourceRecords[sourceLen - 2].Time

      if (targetCycle % sourceCycle != 0) {
          Log(\"targetCycle:\", targetCycle)
          Log(\"sourceCycle:\", sourceCycle)
          throw \"targetCycle is not an integral multiple of sourceCycle.\"
      }

      if ((1000 * 60 * 60) % targetCycle != 0 && (1000 * 60 * 60 * 24) % targetCycle != 0) {
          Log(\"targetCycle:\", targetCycle)
          Log(\"sourceCycle:\", sourceCycle)
          Log((1000 * 60 * 60) % targetCycle, (1000 * 60 * 60 * 24) % targetCycle)
          throw \"targetCycle cannot complete the cycle.\"
      }

      var multiple = targetCycle / sourceCycle


      var isBegin = false
      var count = 0
      var high = 0
      var low = 0
      var open = 0
      var close = 0
      var time = 0
      var vol = 0
      for (var i = 0 ; i < sourceLen ; i++) {
          // Get the time zone offset value
          var d = new Date()
          var n = d.getTimezoneOffset()

          if ((1000 * 60 * 60 * 24) - sourceRecords[i].Time % (1000 * 60 * 60 * 24) + (n * 1000 * 60)) % targetCycle == 0) {
              isBegin = true
          }

          if (isBegin) {
              if (count == 0) {
                  High = sourceRecords[i].High
                  Low = sourceRecords[i].Low
                  Open = sourceRecords[i].Open
                  Close = sourceRecords[i].Close
                  Time = sourceRecords[i].Time
                  Vol = sourceRecords[i].Volume

                  count++
              } else if (count < multiple) {
                  High = Math.max(high, sourceRecords[i].High)
                  Low = Math.min(low, sourceRecords[i].Low)
                  Close = sourceRecords[i].Close
                  Vol += sourceRecords[i].Volume

                  count++
              }

              if (count == multiple || i == sourceLen - 1) {
                  Ret.push({
                      High : high,
                      Low : low,
                      Open : open,
                      Close : close,
                      Time : time,
                      Volume : vol,
                  })
                  count = 0
              }
          }
      }

      Return ret
  }

  // test
  function main () {
      while (true) {
          var r = exchange.GetRecords() // Raw data, as the basic K-line data of the synthesize K line. for example, to synthesize a 4-hour K-line, you can use the 1-hour K-line as the raw data.
          var r2 = GetNewCycleRecords(r, 1000 * 60 * 60 * 4) // Pass the original K-line data r through the GetNewCycleRecords function, and the target cycles, 1000 * 60 * 60 * 4, ie the target synthesis cycle is 4 hours K-line data .

          $.PlotRecords(r2, \"r2\") // The strategy class library bar can be selected by check the line class library, and calling the $.PlotRecords line drawing class library to export the function drawing.
          Sleep(1000) // Each cycle is separated by 1000 milliseconds, preventing access to the K-line interface too much, resulting in transaction restrictions.
      }
  }
实际上,要合成 K 线,您需要两件事。首先是原材料数据,即较小周期的K线数据。在这个例子中,var r = exchange.GetRecords()获取较小的周期K线数据。
二是算出合成周期的大小,我们使用GetNewCycleRecords函数算法来做这个,最后就可以返回一个合成的K线数组结构的数据了。
请注意:
- 目标周期不能小于你在GetNewCycleRecords函数中作为数据原材料传入的K线的周期。因为你无法通过更大的循环来合成更小的循环数据。反之是然。
- 目标循环必须设置为“循环关闭”。什么是“循环关闭”?简单地说,在一小时内或一天内,将目标周期时间范围组合起来形成一个闭环。
例如:
12分钟周期的K线从每小时0:0开始,第一个周期为00:00:00~00:12:00,第二个周期为00:12:00~00:24:00 ,第三个周期为00:24:00~00:36:00,第四个周期为00:36:00~00:48:00,第五个周期为00:48:00~01:00:00,即正好是一个完整的一小时。
如果是13分钟的循环,则为未关闭的循环。通过这种循环计算的数据不是唯一的,因为合成数据根据合成数据的起点而不同。
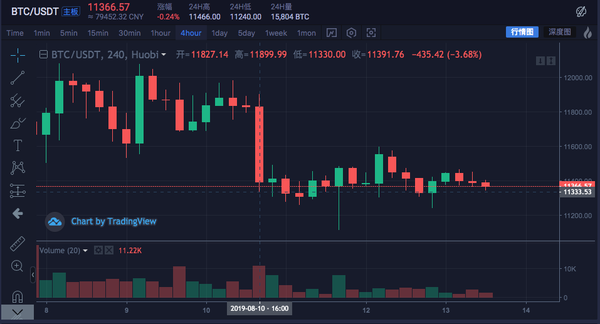
在真实市场中运行它:
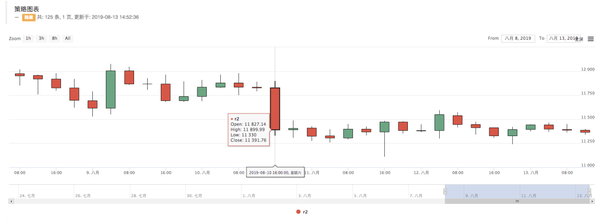

对比交换图

- 使用K线数据构造所需的数据结构
我想计算所有 K 线的最高价格的移动平均线。我该怎么办?
通常我们使用收盘价的平均值来计算移动平均线,但有时也有使用最高价、最低价、开盘价等的需求。
对于这些额外的需求,exchange.GetRecords()函数返回的K线数据不能直接传递给指标计算函数。
eg:
均线talib.MA指标计算函数有两个参数,第一个是需要传入的数据,第二个是指标周期参数。
例如,我们需要计算如下所示的指标。
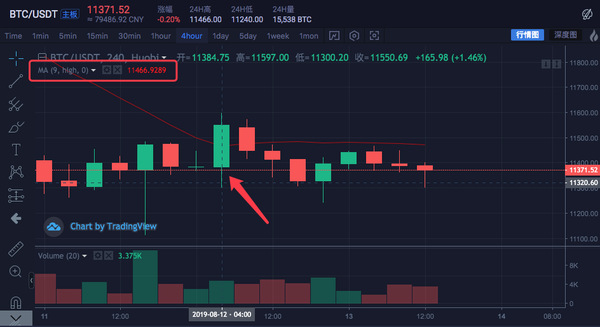

K线周期为4小时。
在交易所市场报价图表上,已经设置了一条平均线,周期参数为 9。
计算的数据源使用每根柱的最高价格。
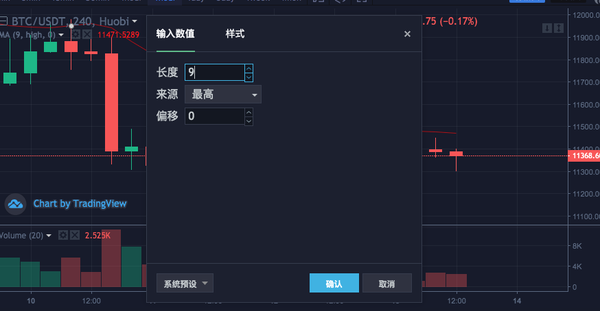

也就是说,这条移动平均线是由九个 4 小时周期 K 线 Bar 的最高均价的平均值组成。
我们自己建一个数据,看看和交易所的数据是不是一样。
var highs = []
for (var i = 0 ; i < r2.length ; i++) {
    highs.push(r2[i].High)
}
由于我们需要计算每个 Bar 的最高价格来获得移动平均线指标的值,因此我们需要构造一个数组,其中每个数据元素都有每个 Bar 的最高价格。
可以看到highs变量最初是一个空数组,然后我们遍历r2 k线数据变量(不记得r2了?看上面合成4小时k线的main函数中的代码)。
读取 r2 的每个 Bar 的最高价(即 r2[i].High,i 范围从 0 到 r2.length – 1),然后推入highs。这样我们只是构造了一个与K线数据Bar一一对应的数据结构。
这时,highs可以通过talib.MA函数来计算移动平均线。
完整示例:
function main () {
     while (true) {
         var r = exchange.GetRecords()
         var r2 = GetNewCycleRecords(r, 1000 * 60 * 60 * 4)
         if (!r2) {
             Continue
         }

         $.PlotRecords(r2, \"r2\") // Draw the K line

         var highs = []
         for (var i = 0 ; i < r2.length ; i++) {
             Highs.push(r2[i].High)
         }

         var ma = talib.MA(highs, 9) // use the moving average function \"talib.MA\" to calculate the moving average indicator
         $.PlotLine(\"high_MA9\", ma[ma.length - 2], r2[r2.length - 2].Time) // Use the line drawing library to draw the moving average indicator on the chart

         Sleep(1000)
     }
}
回测:
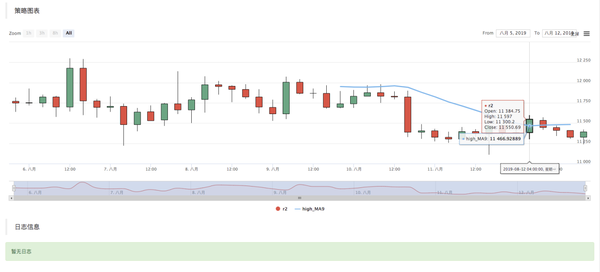

可以看到图中鼠标点位置的平均指标值为11466.9289
以上代码可以复制到策略运行测试,记得勾选“画线库”并保存!
- 加密货币市场K线数据获取方法
FMZ量化平台已经有了一个封装好的接口,即exchange.GetRecords函数,获取K线数据。
下面重点介绍直接访问交易所的K线数据接口获取数据,因为有时需要指定参数才能获取更多的K线,封装GetRecords接口一般返回100k线。如果遇到最初需要100多条K线的策略,需要等待采集过程。
为了让策略尽快生效,可以封装一个函数,直接访问交易所的K线接口,指定参数获取更多的K线数据。
以火必交易所的 BTC_USDT 交易对为例,我们实现这个需求:
找到交易所的API文档,查看K线接口说明:
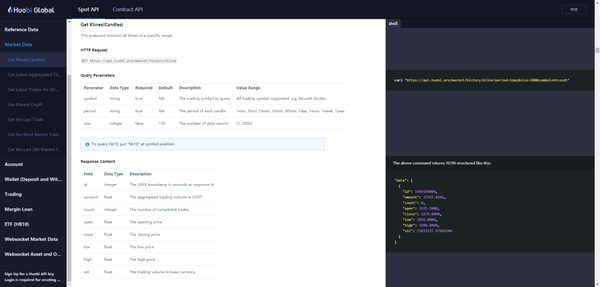

https://huobiapi.github.io/docs/spot/v1/en/#get-klines-candles
参数:
名称
类型
有必要吗
描述
价值
象征
细绳
真的
交易对
btcusdt, ethbtc…
时期
细绳
真的
返回数据的时间粒度,即每k行的时间间隔
1 分钟、5 分钟、15 分钟、30 分钟、60 分钟、1 天、1 个月、1 周、1 年
尺寸
整数
错误的
返回K行数据的数量
[1, 2000]
测试代码:
function GetRecords_Huobi (period, size, symbol) {
    var url = \"https://api.huobi.pro/market/history/kline?\" + \"period=\" + period + \"&size=\" + size + \"&symbol=\" + symbol
    var ret = HttpQuery(url)

    try {
        var jsonData = JSON.parse(ret)
        var records = []
        for (var i = jsonData.data.length - 1; i >= 0 ; i--) {
            records.push({
                Time : jsonData.data[i].id * 1000,
                High : jsonData.data[i].high,
                Open : jsonData.data[i].open,
                Low : jsonData.data[i].low,
                Close : jsonData.data[i].close,
                Volume : jsonData.data[i].vol,
            })
        }
        return records
    } catch (e) {
        Log(e)
    }
}


function main() {
    var records = GetRecords_Huobi(\"1day\", \"300\", \"btcusdt\")
    Log(records.length)
    $.PlotRecords(records, \"K\")
}
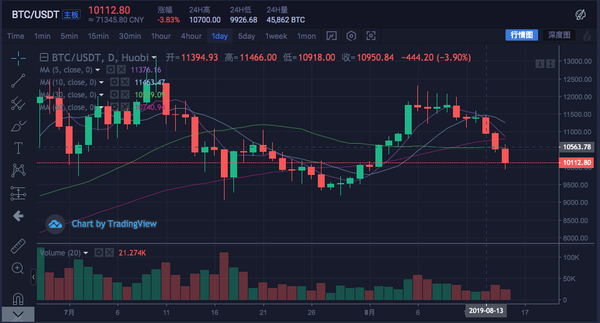

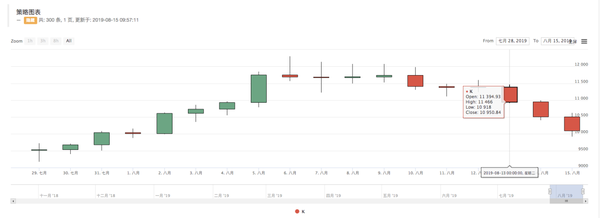

可以看到在log上,printrecords.length是300,也就是recordsK线数据条的个数是300。


FMZ量化交易平台邀请链接:https://www.fmz.com/
全球最大交易所币安,国区邀请链接:https://accounts.binance.com/zh-CN/register?ref=16003031 币安注册不了IP地址用香港,居住地选香港,认证照旧,邮箱推荐如gmail、outlook。支持币种多,交易安全!
买好币上KuCoin:https://www.kucoin.com/r/af/1f7w3 CoinMarketCap前五的交易所,注册友好操简单快捷!
目前不清退的交易所推荐:
1、全球第二大交易所OKX欧意,邀请链接:https://www.myts3cards.com/cn/join/1837888 注册简单,交易不需要实名,新用户能开合约,币种多,交易量大!。
2、老牌交易所比特儿现改名叫芝麻开门 :https://www.gate.win/signup/649183
买好币上币库:https://www.kucoin.com/r/1f7w3
火必所有用户现在可用了,但是要重新注册账号火币:https://www.huobi.com
全球最大交易所币安,
国区邀请链接:https://accounts.suitechsui.mobi/zh-CN/register?ref=16003031 支持86手机号码,网页直接注册。
在编写量化交易策略时,使用K线数据,经常会出现需要非标准周期K线数据的情况。例如,需要12分钟周期K线数据和4小时K线周期数据。通常这种非标准的 Cycles 不是直接可用的。那么我们如何应对这样的需求呢?
非标准周期K线数据可以通过组合较小周期的数据得到。想象一下,多周期的最高价算作多周期K线合成后的最高价,最低价算作合成后的最低价,开盘价不变。合成K线原材料数据的第一开盘价。收盘价对应K线最后原材料数据的收盘价。时间采用开盘价k线的时间。交易量使用汇总和计算的原材料数据。
我们以区块链资产 BTC_USDT 为例,将 1 小时合成为 4 小时。


收盘价为03:00最后一条K线收盘价:11384.71
最高价为求其中最高价:11447.07
最低价为求其中最低价:11365.51
High: 11447.07
Open: 11382.57
Low: 11365.51
Close: 11384.71
Time: 209.8.12 00:00

了解初步思路后,可以手动编写代码实现需求。
function GetNewCycleRecords (sourceRecords, targetCycle) { // K line synthesis function
var ret = []
// First get the source K line data cycle
if (!sourceRecords || sourceRecords.length < 2) {
Return null
}
var sourceLen = sourceRecords.length
var sourceCycle = sourceRecords[sourceLen - 1].Time - sourceRecords[sourceLen - 2].Time
if (targetCycle % sourceCycle != 0) {
Log(\"targetCycle:\", targetCycle)
Log(\"sourceCycle:\", sourceCycle)
throw \"targetCycle is not an integral multiple of sourceCycle.\"
}
if ((1000 * 60 * 60) % targetCycle != 0 && (1000 * 60 * 60 * 24) % targetCycle != 0) {
Log(\"targetCycle:\", targetCycle)
Log(\"sourceCycle:\", sourceCycle)
Log((1000 * 60 * 60) % targetCycle, (1000 * 60 * 60 * 24) % targetCycle)
throw \"targetCycle cannot complete the cycle.\"
}
var multiple = targetCycle / sourceCycle
var isBegin = false
var count = 0
var high = 0
var low = 0
var open = 0
var close = 0
var time = 0
var vol = 0
for (var i = 0 ; i < sourceLen ; i++) {
// Get the time zone offset value
var d = new Date()
var n = d.getTimezoneOffset()
if ((1000 * 60 * 60 * 24) - sourceRecords[i].Time % (1000 * 60 * 60 * 24) + (n * 1000 * 60)) % targetCycle == 0) {
isBegin = true
}
if (isBegin) {
if (count == 0) {
High = sourceRecords[i].High
Low = sourceRecords[i].Low
Open = sourceRecords[i].Open
Close = sourceRecords[i].Close
Time = sourceRecords[i].Time
Vol = sourceRecords[i].Volume
count++
} else if (count < multiple) {
High = Math.max(high, sourceRecords[i].High)
Low = Math.min(low, sourceRecords[i].Low)
Close = sourceRecords[i].Close
Vol += sourceRecords[i].Volume
count++
}
if (count == multiple || i == sourceLen - 1) {
Ret.push({
High : high,
Low : low,
Open : open,
Close : close,
Time : time,
Volume : vol,
})
count = 0
}
}
}
Return ret
}
// test
function main () {
while (true) {
var r = exchange.GetRecords() // Raw data, as the basic K-line data of the synthesize K line. for example, to synthesize a 4-hour K-line, you can use the 1-hour K-line as the raw data.
var r2 = GetNewCycleRecords(r, 1000 * 60 * 60 * 4) // Pass the original K-line data r through the GetNewCycleRecords function, and the target cycles, 1000 * 60 * 60 * 4, ie the target synthesis cycle is 4 hours K-line data .
$.PlotRecords(r2, \"r2\") // The strategy class library bar can be selected by check the line class library, and calling the $.PlotRecords line drawing class library to export the function drawing.
Sleep(1000) // Each cycle is separated by 1000 milliseconds, preventing access to the K-line interface too much, resulting in transaction restrictions.
}
}
var r = exchange.GetRecords()获取较小的周期K线数据。

我想计算所有 K 线的最高价格的移动平均线。我该怎么办?
均线
talib.MA指标计算函数有两个参数,第一个是需要传入的数据,第二个是指标周期参数。

var highs = []
for (var i = 0 ; i < r2.length ; i++) {
highs.push(r2[i].High)
}
highs变量最初是一个空数组,然后我们遍历r2 k线数据变量(不记得r2了?看上面合成4小时k线的main函数中的代码)。highs。这样我们只是构造了一个与K线数据Bar一一对应的数据结构。highs可以通过talib.MA函数来计算移动平均线。function main () {
while (true) {
var r = exchange.GetRecords()
var r2 = GetNewCycleRecords(r, 1000 * 60 * 60 * 4)
if (!r2) {
Continue
}
$.PlotRecords(r2, \"r2\") // Draw the K line
var highs = []
for (var i = 0 ; i < r2.length ; i++) {
Highs.push(r2[i].High)
}
var ma = talib.MA(highs, 9) // use the moving average function \"talib.MA\" to calculate the moving average indicator
$.PlotLine(\"high_MA9\", ma[ma.length - 2], r2[r2.length - 2].Time) // Use the line drawing library to draw the moving average indicator on the chart
Sleep(1000)
}
}

FMZ量化平台已经有了一个封装好的接口,即exchange.GetRecords函数,获取K线数据。
GetRecords接口一般返回100k线。如果遇到最初需要100多条K线的策略,需要等待采集过程。
function GetRecords_Huobi (period, size, symbol) {
var url = \"https://api.huobi.pro/market/history/kline?\" + \"period=\" + period + \"&size=\" + size + \"&symbol=\" + symbol
var ret = HttpQuery(url)
try {
var jsonData = JSON.parse(ret)
var records = []
for (var i = jsonData.data.length - 1; i >= 0 ; i--) {
records.push({
Time : jsonData.data[i].id * 1000,
High : jsonData.data[i].high,
Open : jsonData.data[i].open,
Low : jsonData.data[i].low,
Close : jsonData.data[i].close,
Volume : jsonData.data[i].vol,
})
}
return records
} catch (e) {
Log(e)
}
}
function main() {
var records = GetRecords_Huobi(\"1day\", \"300\", \"btcusdt\")
Log(records.length)
$.PlotRecords(records, \"K\")
}


records.length是300,也就是recordsK线数据条的个数是300。
买好币上KuCoin:https://www.kucoin.com/r/af/1f7w3 CoinMarketCap前五的交易所,注册友好操简单快捷!
目前不清退的交易所推荐:
1、全球第二大交易所OKX欧意,邀请链接:https://www.myts3cards.com/cn/join/1837888 注册简单,交易不需要实名,新用户能开合约,币种多,交易量大!。
2、老牌交易所比特儿现改名叫芝麻开门 :https://www.gate.win/signup/649183
买好币上币库:https://www.kucoin.com/r/1f7w3
