
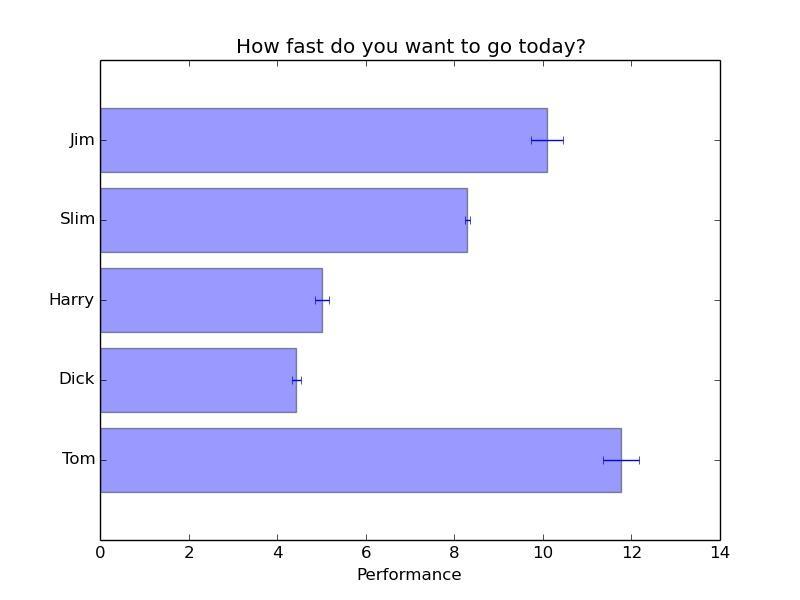
matplotlib 画图(一):横向柱状图
admin
2023-07-30 20:45:41
0次
barh.jpg
代码
\"\"\"
Simple demo of a horizontal bar chart.
\"\"\"
import matplotlib.pyplot as plt
plt.rcdefaults()
import numpy as np
import matplotlib.pyplot as plt

# Example data
people = (\'Tom\', \'Dick\', \'Harry\', \'Slim\', \'Jim\')
y_pos = np.arange(len(people))
performance = 3 + 10 * np.random.rand(len(people))
error = np.random.rand(len(people))

plt.barh(y_pos, performance, xerr=error, align=\'center\', alpha=0.4)
plt.yticks(y_pos, people)
plt.xlabel(\'Performance\')
plt.title(\'How fast do you want to go today?\')
plt.savefig(\"barh.eps\",format=\"eps\")
解析
plt.rcdefaults()
恢复 rc 的默认设置
barh()
主要功能:做一个横向条形图,横向条的矩形大小为: left, left + width, bottom, bottom + height
参数:barh ( bottom , width , height =0.8, left =0, ** kwargs )
返回类型:一个 class 类别,matplotlib.patches.Rectangle实例
参数说明:
- bottom: Bars 的垂直位置的底部边缘
- width: Bars 的长度
可选参数:
- height: bars 的高度
- left: bars 左边缘 x 轴坐标值
- color: bars 颜色
- edgecolor: bars 边缘颜色
- linewidth: bar 边缘宽度;None 表示默认宽度;0 表示不 i 绘制边缘
- xerr: 若不为 None,将在 bar 图上生成 errobars
- yerr: 若不为 None,将在 bar 图上生成 errobars
- ecolor: 指定 errorbar 颜色
- capsize: 指定 errorbar 的顶部(cap)长度
- align: ‘edge’ (默认) | ‘center’:‘edge’以底部为准对齐;‘center’以 y 轴作为中心?
- log: [False|True] False (默认),若为 True,使用 log 坐标
更多文章可以访问我的个人博客
上一篇:python爬虫(一)
相关内容
热门资讯
500 行 Python 代码...
语法分析器描述了一个句子的语法结构,用来帮助其他的应用进行推理。自然语言引入了很多意外的歧义,以我们...
定时清理删除C:\Progra...
C:\Program Files (x86)下面很多scoped_dir开头的文件夹 写个批处理 定...
65536是2的几次方 计算2...
65536是2的16次方:65536=2⁶
65536是256的2次方:65536=256
6553...
Mobi、epub格式电子书如...
在wps里全局设置里有一个文件关联,打开,勾选电子书文件选项就可以了。
scoped_dir32_70...
一台虚拟机C盘总是莫名奇妙的空间用完,导致很多软件没法再运行。经过仔细检查发现是C:\Program...
pycparser 是一个用...
`pycparser` 是一个用 Python 编写的 C 语言解析器。它可以用来解析 C 代码并构...
小程序支付时提示:appid和...
[Q]小程序支付时提示:appid和mch_id不匹配
[A]小程序和微信支付没有进行关联,访问“小...
python绘图库Matplo...
本文简单介绍了Python绘图库Matplotlib的安装,简介如下:
matplotlib是pyt...
Prometheus+Graf...
一,Prometheus概述
1,什么是Prometheus?Prometheus是最初在Sound...
微信小程序使用slider实现...
众所周知哈,微信小程序里面的音频播放是没有进度条的,但最近有个项目呢,客户要求音频要有进度条控制,所...