
python批量制作雷达图的实现方法
admin
2023-08-01 18:19:57
0次
前言
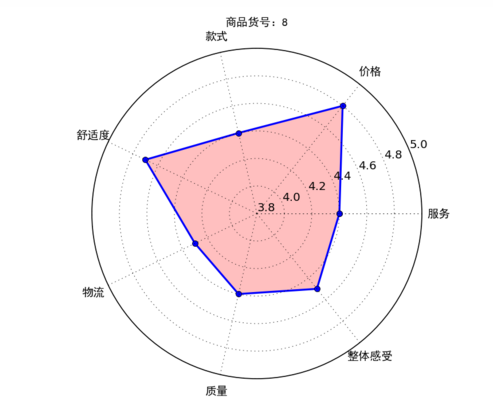
因为工作需要有时候要画雷达图,但是数据好多组怎么办?不能一个一个点excel去画吧,那么可以利用python进行批量制作,得到样式如下:
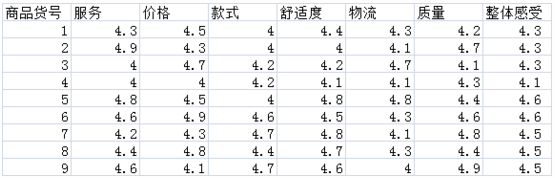
首先制作一个演示的excel,评分为excel随机数生成:
1 =INT((RAND()+4)*10)/10
加入标签等得到的excel样式如下(部分,共计32行):
那么接下来就是打开python写码了,本文是基于pycharm进行编写
 wb = load_workbook(filename=r\'C:\\Users\\Administrator\\Desktop\\数据指标.xlsx\') ##读取路径
   ws = wb.get_sheet_by_name(\"Sheet1\") ##读取名字为Sheet1的sheet表

   info_id = []
   info_first = []

   for row_A in range(2, 32): ## 遍历第2行到32行
     id = ws.cell(row=row_A, column=1).value ## 遍历第2行到32行,第1列
     info_id.append(id)
   for col in range(2, 9): ##读取第1到9列
     first = ws.cell(row=1, column=col).value
     info_first.append(first) ##得到1到8列的标签

   info_data = []
   for row_num_BtoU in range(2, len(info_id) + 2): ## 遍历第2行到32行
     row_empty = [] ##建立一个空数组作为临时储存地,每次换行就被清空
     for i in range(2, 9): ## 遍历第2行到32行,第2到9列
       data_excel = ws.cell(row=row_num_BtoU, column=i).value
       if data_excel == None:
         pass
       else:
         row_empty.append(data_excel) ##将单元格信息储存进去
     info_data.append(row_empty)
分步讲解:
读取excel表格:
   wb = load_workbook(filename=r\'C:\\Users\\Administrator\\Desktop\\数据指标.xlsx\') ##读取路径
   ws = wb.get_sheet_by_name(\"Sheet1\") ##读取名字为Sheet1的sheet表
需要用到库:
import xlsxwriter
from openpyxl import load_workbook
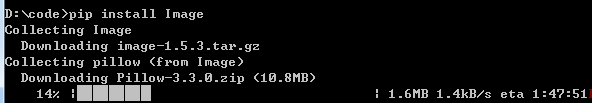
在命令指示符下输入:
pip install xlsxwriter
等待安装即可,后面的库也是如此:
将第一列ID储存,以及第一行的标签,标签下面的数值分别储存在:
  info_id = []
  info_first = []
  info_data = []
读取数据后接下来需要设置写入的格式:
 workbook = xlsxwriter.Workbook(\'C:\\\\Users\\\\Administrator\\\\Desktop\\\\result.xlsx\')
   worksheet = workbook.add_worksheet() # 创建一个工作表对象
   #字体格式
   font = workbook.add_format(
     {\'border\': 1, \'align\': \'center\', \'font_size\': 11, \'font_name\': \'微软雅黑\'}) ##字体居中,11号,微软雅黑,给一般的信息用的
   #写下第一行第一列的标签
   worksheet.write(0, 0, \'商品货号\', font)
   ##设置图片的那一列宽度
   worksheet.set_column(0, len(info_first) + 1, 11) # 设定第len(info_first) + 1列的宽度为11
将标签数据等写入新的excel表格中:
#新建一个excel保存结果
   workbook = xlsxwriter.Workbook(\'C:\\\\Users\\\\Administrator\\\\Desktop\\\\result.xlsx\')
   worksheet = workbook.add_worksheet() # 创建一个工作表对象
   #字体格式
   font = workbook.add_format(
     {\'border\': 1, \'align\': \'center\', \'font_size\': 11, \'font_name\': \'微软雅黑\'}) ##字体居中,11号,微软雅黑,给一般的信息用的
   #写下第一行第一列的标签
   worksheet.write(0, 0, \'商品货号\', font)
   ##设置图片的那一列宽度
   worksheet.set_column(0, len(info_first) + 1, 11) # 设定第len(info_first) + 1列的宽度为11

   ##写入标签
   for k in range(0,7):
     worksheet.write(0, k + 1, info_first[k], font)
   #写入最后一列标签
   worksheet.write(0, len(info_first) + 1, \'雷达图\', font)
制作雷达图:
   #设置雷达各个顶点的名称
   labels = np.array(info_first)
   #数据个数
   data_len = len(info_first)
   for i in range(0,len(info_id)):
     data = np.array(info_data[i])

     angles = np.linspace(0, 2*np.pi, data_len, endpoint=False)
     data = np.concatenate((data, [data[0]])) # 闭合
     angles = np.concatenate((angles, [angles[0]])) # 闭合

     fig = plt.figure()
     ax = fig.add_subplot(111, polar=True)# polar参数!!
     ax.plot(angles, data, \'bo-\', linewidth=2)# 画线
     ax.fill(angles, data, facecolor=\'r\', alpha=0.25)# 填充
     ax.set_thetagrids(angles * 180/np.pi, labels, fontproperties=\"SimHei\")
     ax.set_title(\"商品货号:\" + str(info_id[i]), va=\'bottom\', fontproperties=\"SimHei\")
     ax.set_rlim(3.8,5)# 设置雷达图的范围
     ax.grid(True)
     plt.savefig(\"C:\\\\Users\\\\Administrator\\\\Desktop\\\\result\\\\商品货号:\" + str(info_id[i]) + \".png\", dpi=120)
图片太大怎么办?用库改变大小即可:
     import Image
     ##更改图片大小
     infile = “C:\\\\Users\\\\Administrator\\\\Desktop\\\\result\\\\商品货号:\" + str(info_id[i]) + \".png“
     outfile = ”C:\\\\Users\\\\Administrator\\\\Desktop\\\\result1\\\\商品货号:\" + str(info_id[i]) + \".png”
     im = Image.open(infile)
     (x, y) = im.size
     x_s = 80  ## 设置长
     y_s = 100  ## 设置宽
     out = im.resize((x_s, y_s), Image.ANTIALIAS)
     out.save(outfile,\'png\',quality = 95)
将大图片和小图片放在了result和result1两个不同的文件夹,需要再前边创建这两个文件夹:
   if os.path.exists(r\'C:\\\\Users\\\\Administrator\\\\Desktop\\\\result\'): # 建立一个文件夹在桌面,文件夹为result
     print(\'result文件夹已经在桌面存在,继续运行程序……\')
   else:
     print(\'result文件夹不在桌面,新建文件夹result\')
     os.mkdir(r\'C:\\\\Users\\\\Administrator\\\\Desktop\\\\result\')
     print(\'文件夹建立成功,继续运行程序\')

   if os.path.exists(r\'C:\\\\Users\\\\Administrator\\\\Desktop\\\\result1\'): # 建立一个文件夹在C盘,文件夹为result1
     print(\'result1文件夹已经在桌面存在,继续运行程序……\')
   else:
     print(\'result1文件夹不在桌面,新建文件夹result1\')
     os.mkdir(r\'C:\\\\Users\\\\Administrator\\\\Desktop\\\\result1\')
     print(\'文件夹建立成功,继续运行程序\')
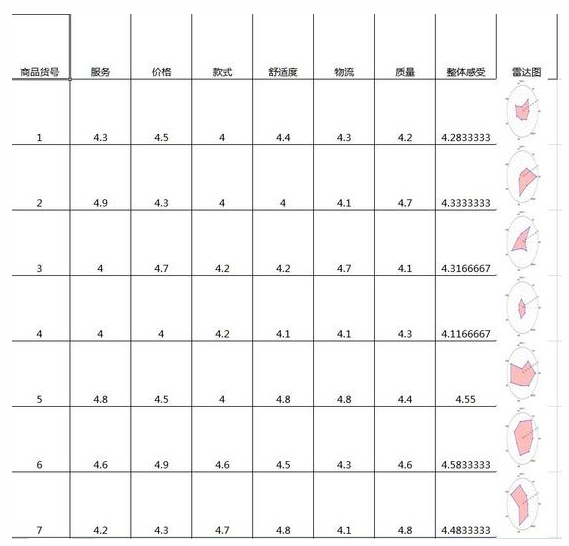
最后插入图片到excel中:
     worksheet.insert_image(i + 1, len(info_first) + 1, \'C:\\\\Users\\\\Administrator\\\\Desktop\\\\result1\\\\\' + \"商品货号:\" + str(info_id[i]) + \'.png\') ##写入图片
     time.sleep(1)##防止写入太快电脑死机
     plt.close() #  一定要关掉图片,不然python打开图片20个后会崩溃

   workbook.close()#最后关闭excel
得到的效果如下:
附上完整代码:
  import numpy as np
  import matplotlib.pyplot as plt
  import xlsxwriter
  from openpyxl import load_workbook
  import os
  import time
  from PIL import Image

  if __name__ == \'__main__\':

   if os.path.exists(r\'C:\\\\Users\\\\Administrator\\\\Desktop\\\\result\'): # 建立一个文件夹在桌面,文件夹为result
     print(\'result文件夹已经在桌面存在,继续运行程序……\')
   else:
     print(\'result文件夹不在桌面,新建文件夹result\')
     os.mkdir(r\'C:\\\\Users\\\\Administrator\\\\Desktop\\\\result\')
     print(\'文件夹建立成功,继续运行程序\')

   if os.path.exists(r\'C:\\\\Users\\\\Administrator\\\\Desktop\\\\result1\'): # 建立一个文件夹在C盘,文件夹为result1
     print(\'result1文件夹已经在桌面存在,继续运行程序……\')
   else:
     print(\'result1文件夹不在桌面,新建文件夹result1\')
     os.mkdir(r\'C:\\\\Users\\\\Administrator\\\\Desktop\\\\result1\')
     print(\'文件夹建立成功,继续运行程序\')

   wb = load_workbook(filename=r\'C:\\Users\\Administrator\\Desktop\\数据指标.xlsx\') ##读取路径
   ws = wb.get_sheet_by_name(\"Sheet1\") ##读取名字为Sheet1的sheet表

   info_id = []
   info_first = []

   for row_A in range(2, 32): ## 遍历第2行到32行
     id = ws.cell(row=row_A, column=1).value ## 遍历第2行到32行,第1列
     info_id.append(id)
   for col in range(2, 9): ##读取第1到9列
     first = ws.cell(row=1, column=col).value
     info_first.append(first) ##得到1到8列的标签
   print(info_id)
   print(info_first)

   info_data = []
   for row_num_BtoU in range(2, len(info_id) + 2): ## 遍历第2行到32行
     row_empty = [] ##建立一个空数组作为临时储存地,每次换行就被清空
     for i in range(2, 9): ## 遍历第2行到32行,第2到9列
       data_excel = ws.cell(row=row_num_BtoU, column=i).value
       if data_excel == None:
         pass
       else:
         row_empty.append(data_excel) ##将单元格信息储存进去
     info_data.append(row_empty)
   print(info_data)
   print(len(info_data))

   # 设置雷达各个顶点的名称
   labels = np.array(info_first)
   # 数据个数
   data_len = len(info_first)
   # 新建一个excel保存结果
   workbook = xlsxwriter.Workbook(\'C:\\\\Users\\\\Administrator\\\\Desktop\\\\result.xlsx\')
   worksheet = workbook.add_worksheet() # 创建一个工作表对象
   # 字体格式
   font = workbook.add_format(
     {\'border\': 1, \'align\': \'center\', \'font_size\': 11, \'font_name\': \'微软雅黑\'}) ##字体居中,11号,微软雅黑,给一般的信息用的
   # 写下第一行第一列的标签
   worksheet.write(0, 0, \'商品货号\', font)
   ##设置图片的那一列宽度
   worksheet.set_column(0, len(info_first) + 1, 11) # 设定第len(info_first) + 1列的宽度为11

   ##写入标签
   for k in range(0, 7):
     worksheet.write(0, k + 1, info_first[k], font)
   # 写入最后一列标签
   worksheet.write(0, len(info_first) + 1, \'雷达图\', font)

   # 将其他参数写入excel中
   for j in range(0, len(info_id)):
     worksheet.write(j + 1, 0, info_id[j], font) # 写入商品货号
     worksheet.set_row(j, 76) ##设置行宽
     for x in range(0, len(info_first)):
       worksheet.write(j + 1, x + 1, info_data[j][x], font) # 写入商品的其他参数

   for i in range(0, len(info_id)):
     data = np.array(info_data[i])

     angles = np.linspace(0, 2 * np.pi, data_len, endpoint=False)
     data = np.concatenate((data, [data[0]])) # 闭合
     angles = np.concatenate((angles, [angles[0]])) # 闭合

     fig = plt.figure()
     ax = fig.add_subplot(111, polar=True) # polar参数!!
     ax.plot(angles, data, \'bo-\', linewidth=2) # 画线
     ax.fill(angles, data, facecolor=\'r\', alpha=0.25) # 填充
     ax.set_thetagrids(angles * 180 / np.pi, labels, fontproperties=\"SimHei\")
     ax.set_title(\"商品货号:\" + str(info_id[i]), va=\'bottom\', fontproperties=\"SimHei\")
     ax.set_rlim(3.8, 5) # 设置雷达图的范围
     ax.grid(True)
     plt.savefig(\"C:\\\\Users\\\\Administrator\\\\Desktop\\\\result\\\\商品货号:\" + str(info_id[i]) + \".png\", dpi=120)
     # plt.show()在python中显示

     ##更改图片大小
     infile = \"C:\\\\Users\\\\Administrator\\\\Desktop\\\\result\\\\商品货号:\" + str(info_id[i]) + \".png\"
     outfile = \"C:\\\\Users\\\\Administrator\\\\Desktop\\\\result1\\\\商品货号:\" + str(info_id[i]) + \".png\"
     im = Image.open(infile)
     (x, y) = im.size
     x_s = 80 ## 设置长
     y_s = 100 ## 设置宽
     out = im.resize((x_s, y_s), Image.ANTIALIAS)
     out.save(outfile, \'png\', quality=95)

     worksheet.insert_image(i + 1, len(info_first) + 1,
                \'C:\\\\Users\\\\Administrator\\\\Desktop\\\\result1\\\\\' + \"商品货号:\" + str(
                  info_id[i]) + \'.png\') ##写入图片
     time.sleep(1) ##防止写入太快电脑死机
     plt.close() # 一定要关掉图片,不然python打开图片20个后会崩溃

   workbook.close() # 最后关闭excel
以上就是本文介绍利用python批量制作雷达图的实现方法,希望给学习python的大家有所帮助
相关内容
热门资讯
500 行 Python 代码...
语法分析器描述了一个句子的语法结构,用来帮助其他的应用进行推理。自然语言引入了很多意外的歧义,以我们...
定时清理删除C:\Progra...
C:\Program Files (x86)下面很多scoped_dir开头的文件夹 写个批处理 定...
65536是2的几次方 计算2...
65536是2的16次方:65536=2⁶
65536是256的2次方:65536=256
6553...
Mobi、epub格式电子书如...
在wps里全局设置里有一个文件关联,打开,勾选电子书文件选项就可以了。
scoped_dir32_70...
一台虚拟机C盘总是莫名奇妙的空间用完,导致很多软件没法再运行。经过仔细检查发现是C:\Program...
pycparser 是一个用...
`pycparser` 是一个用 Python 编写的 C 语言解析器。它可以用来解析 C 代码并构...
小程序支付时提示:appid和...
[Q]小程序支付时提示:appid和mch_id不匹配
[A]小程序和微信支付没有进行关联,访问“小...
Prometheus+Graf...
一,Prometheus概述
1,什么是Prometheus?Prometheus是最初在Sound...
python绘图库Matplo...
本文简单介绍了Python绘图库Matplotlib的安装,简介如下:
matplotlib是pyt...
微信小程序使用slider实现...
众所周知哈,微信小程序里面的音频播放是没有进度条的,但最近有个项目呢,客户要求音频要有进度条控制,所...